Simon (only just started) can measure task durations (min, max, count, maximum concurrency and some timestamps) and has task counters. Other statistics can be added (supported now: standard deviation). The JDBC proxy driver can be used to monitor database usage. The monitors are grouped in a tree. You can disable each monitor individually, or per complete subtree. Jamon adds the ability to measure in any unit (for example euro value of a transaction) and has quite a few monitors for Tomcat, Jetty, etc. Jamon does not organize monitors in a tree, so monitors can be disabled individually, or all at the same time. So Jamon clearly wins on the feature front, but if you're just into the basic stuff Simon is fine. Documentation
One of the weak points of Jamon is its documentation (hence my little project). Simon on the other hand starts with a good set of wiki pages. If these are maintained properly, Simon is the clear winner here. Simon interface
Simon's interface is fairly simple. One gets a monitor through the singleton SimonManager, and call start and stop on it:
Stopwatch simon =
    SimonManager.getStopwatch("simon.test").start();
// Do something
simon.stop();Stopwatch simon = SimonManager.getStopwatch("simon.test");
long hitCount = simon.getCounter();
long max = simon.getMax();
long total = simon.getTotal();
simon.reset();Stopwatch simon = SimonManager.getStopwatch("simon.test");
Map<String, String> sample = simon.sample(true);
long hitCount = Long.parseLong(sample.get("counter"));
long max = Long.parseLong(sample.get("max"));
long total = Long.parseLong(sample.get("total"));Stopwatch simon = SimonManager.getStopwatch("simon.test");
long hitCount;
long max;
long total;
synchronized (simon) {
hitCount = simon.getCounter();
max = simon.getMax();
total = simon.getTotal();
simon.reset();
}Update 2009-01-0: the iterator now actually works. As I am using Jarep to browse through historic measurements, I want to expose the Simon data just like Jarep's servlet exposer for Jamon does. In other words: we need to visit each simon and extract the data as described above. There are 2 approaches to visit all nodes. First is to get all simon names from SimonManager and then request them one by one. The other is to walk the tree of simons. I choose the latter. Unfortunately there is no tree iterator so I created one with commons-collections:
Simon rootSimon = SimonManager.getRootSimon();
ObjectGraphIterator simonIterator =
  new ObjectGraphIterator(rootSimon, new Transformer() {
    private Object previous;
    public Object transform(Object input) {
      if (input == previous) {
        previous = null;
        return input;
      } else {
        previous = input;
        Simon currentSimon = (Simon) input;
        return new IteratorChain(
          new SingletonIterator(currentSimon),
          currentSimon.getChildren().iterator());
      }
}});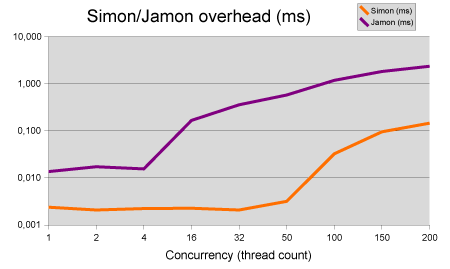 Simon's performance is pretty good! The overhead in my test application doesn't come anywhere near the millisecond range even in highly concurrent situations. Jamon is not so bad either, even though its 5 to 200 times slower, depending on thread contention. With 5 monitors in a request, the overhead per request slowly grows to 0.7 ms for Simon, and quickly grows to 12ms for Jamon.
Note: the test application does nothing else but getting monitors and doing measurements. So the right side of the chart is unrealistic for most environments.
Improving the performance
Simon's performance is pretty good! The overhead in my test application doesn't come anywhere near the millisecond range even in highly concurrent situations. Jamon is not so bad either, even though its 5 to 200 times slower, depending on thread contention. With 5 monitors in a request, the overhead per request slowly grows to 0.7 ms for Simon, and quickly grows to 12ms for Jamon.
Note: the test application does nothing else but getting monitors and doing measurements. So the right side of the chart is unrealistic for most environments.
Improving the performanceEven though the performance is pretty good. I think it can be improved further. I investigated two potential performance improvements:
- Remove the ThreadLocal variable in StopWatchImpl.
- Replace synchronized HashMap with a ConcurrentHashMap in EnabledManager.
The advantages are:
- We no longer need to synchronize the start method.
- We no longer need the thread local variable to store the start time.
- We no longer need the start(key) and stop(key) variants.
- The stopwatch is no longer susceptible for memory leak when a malicious client keeps starting monitors in new threads, but never stops them (someone forgot a finally).
- The stopwatch is no longer susceptible for memory leak when a malicious client keeps starting monitors with start(key) with a new key, but never stops them (again, someone forgot a finally).
If it is desirable to keep the firstUsage and lastUsege timestamps (I don't use them), these can lift along with the start time and be stored during the stop method. Note: this may be unacceptable if you need information on long running operations. To test it out I hacked StopwatchImpl to return a StopwatchMeasurement from the start method. If you look at the implementation you see that StopwatchMeasurement implements Stopwatch so that the idiomatic usage still works:
Stopwatch simon =
    SimonManager.getStopwatch("simon.test").start();
// Do something
simon.stop();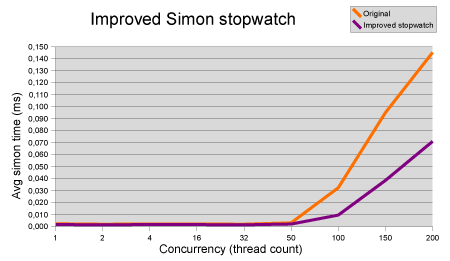 Not bad! Although the results are quite dramatic for the higher thread counts, it still shaves off 20% in situations with less contention.
Recommendation: remove the thread local from StopwatchImpl and change the API as described above.
Replace synchronized HashMap with a ConcurrentHashMap in EnabledManager
Not bad! Although the results are quite dramatic for the higher thread counts, it still shaves off 20% in situations with less contention.
Recommendation: remove the thread local from StopwatchImpl and change the API as described above.
Replace synchronized HashMap with a ConcurrentHashMap in EnabledManagerThe second thing I noticed is that getting a monitor from the SimonManager (the SimonManager.getStopwatch("simon.test") part) happens in a synchronized block and uses a plain HashMap as store. Since Java 5 there is a ConcurrentHashMap implementation which supposedly performs better in almost any circumstances. Lets see. I remove some synchronized keywords, changed the map type, and made the code to add new monitors thread safe. This resulted in a modified EnabledManager. Here are the results. The graph displays a few attempts that differ in the concurrency level parameter to the ConcurrentHashMap constructor. For more accuracy this graph displays the improvement in nanoseconds.
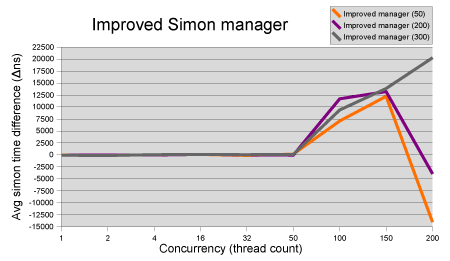 To my big surprise there is no measurable difference with modest contention. During high contention there is a reasonable positive effect that is suddenly converted to a negative effect for very high contention. Only when the currency level is set very high, does the effect stay positive.
Recommendation: don't change the manager.
Conclusions
Although Simon is only young, it is off with a good start. Its clearly faster then Jamon and also on the documentation front Simon wins. Jamon has much more features so it is still a valid choice. When the recommendations in this article are followed, Simon could be better still.
Discussion
To my big surprise there is no measurable difference with modest contention. During high contention there is a reasonable positive effect that is suddenly converted to a negative effect for very high contention. Only when the currency level is set very high, does the effect stay positive.
Recommendation: don't change the manager.
Conclusions
Although Simon is only young, it is off with a good start. Its clearly faster then Jamon and also on the documentation front Simon wins. Jamon has much more features so it is still a valid choice. When the recommendations in this article are followed, Simon could be better still.
DiscussionFollow the discussion of this evaluation on the Java Simon mailing list. References
Code smells from Clean Code by Robin C. Martin:
[F3] Flag arguments
[N7] Names should describe side effects
[G14] Feature Envy
[G21] Understand the algorithm
[G25] Replace magic numbers with named constants
Code smells by me:
[CE6] Incomplete contract
[GE37] Unnecessary conversions
Thank you Erik, I appreciate the article - there is some real work behind it! And you made me to look into Simon even on holidays. :-) I'll reply more via mailing list later.
ReplyDelete